If laboratories have a Laboratory Information Management System (LIMS) they can easily extract Key Performance Indicators (KPIs) and detailed management statistics from the data within the LIMS, providing a rich source of information to optimize operations and eliminate wastage. Yet few laboratories take maximum advantage of this capability.
Autoscribe recently held ran a webinar entitled “Using LIMS Data Analytics to Drive Laboratory Efficiency and Quality” which highlighted typical KPIs needed in a laboratory, including Turn Around Time (TAT), workload, efficiency, and cost. It also showed how Matrix Gemini LIMS can capture and present this data, including performance analysis using Statistical Quality Control (SQC) charts.
Effective laboratory data analytics requires all relevant metadata to be captured as the sample moves through the laboratory process. The importance of identifying, acquiring, and storing this data was emphasized. Each sample record will hold much of the required meta data, especially as the LIMS will keep an audit trail of all the changes and actions that have occurred. However, data from the instrument calibration, competency management, and Corrective Actions and Preventive Actions (CAPA) modules, among others also provide valuable additional sources of information.
Example KPI screens were shown including sample throughput, instrument loading, and client specific TATs. Sample and management reports are very often specific to laboratories, so it is important to be able to easily adapt reports to suit your needs.
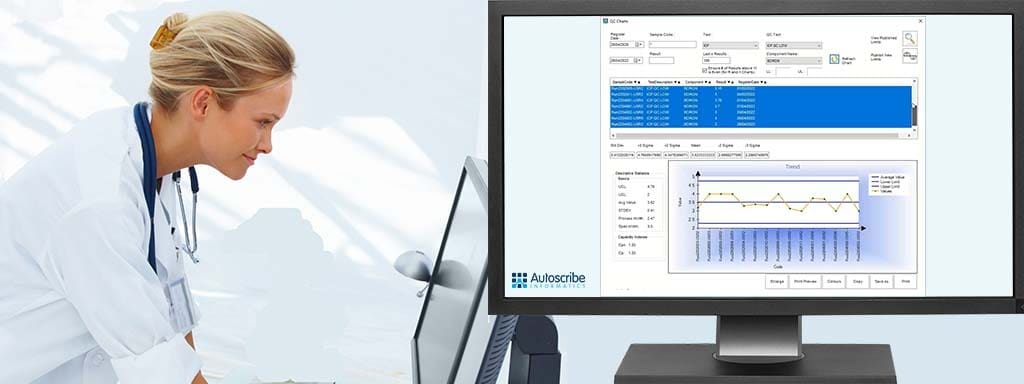
Statistical Quality Control (SQC) charts are built into Matrix Gemini LIMS to quickly perform statistical analysis on QC and sample test results. This highlights variance in results and quickly identifies outliers and process drift, particularly useful in areas such as manufacturing. A QC control chart was demonstrated as an example for attendees. How bracketing can be implemented to take account of both process limits and results of QC samples was discussed, as was automatic calculation of process limits based on previous results.
“Autoscribe Informatics regularly holds educational webinars for the laboratory industry, but our webinar on data analytics broke all records for registration and attendance,” said Marketing Manager, Tim Daniels. “It demonstrates that laboratories are hungry for information on how they can best make use of their data to optimize operations, both within their laboratory and across the Company as a whole.”
This educational video allows people to discover how LIMS can help meet critical goals such as turn-around time, uncover inefficient working practices, and improve pass/fail rates using the statistics from the data captured.
A video of this webinar


